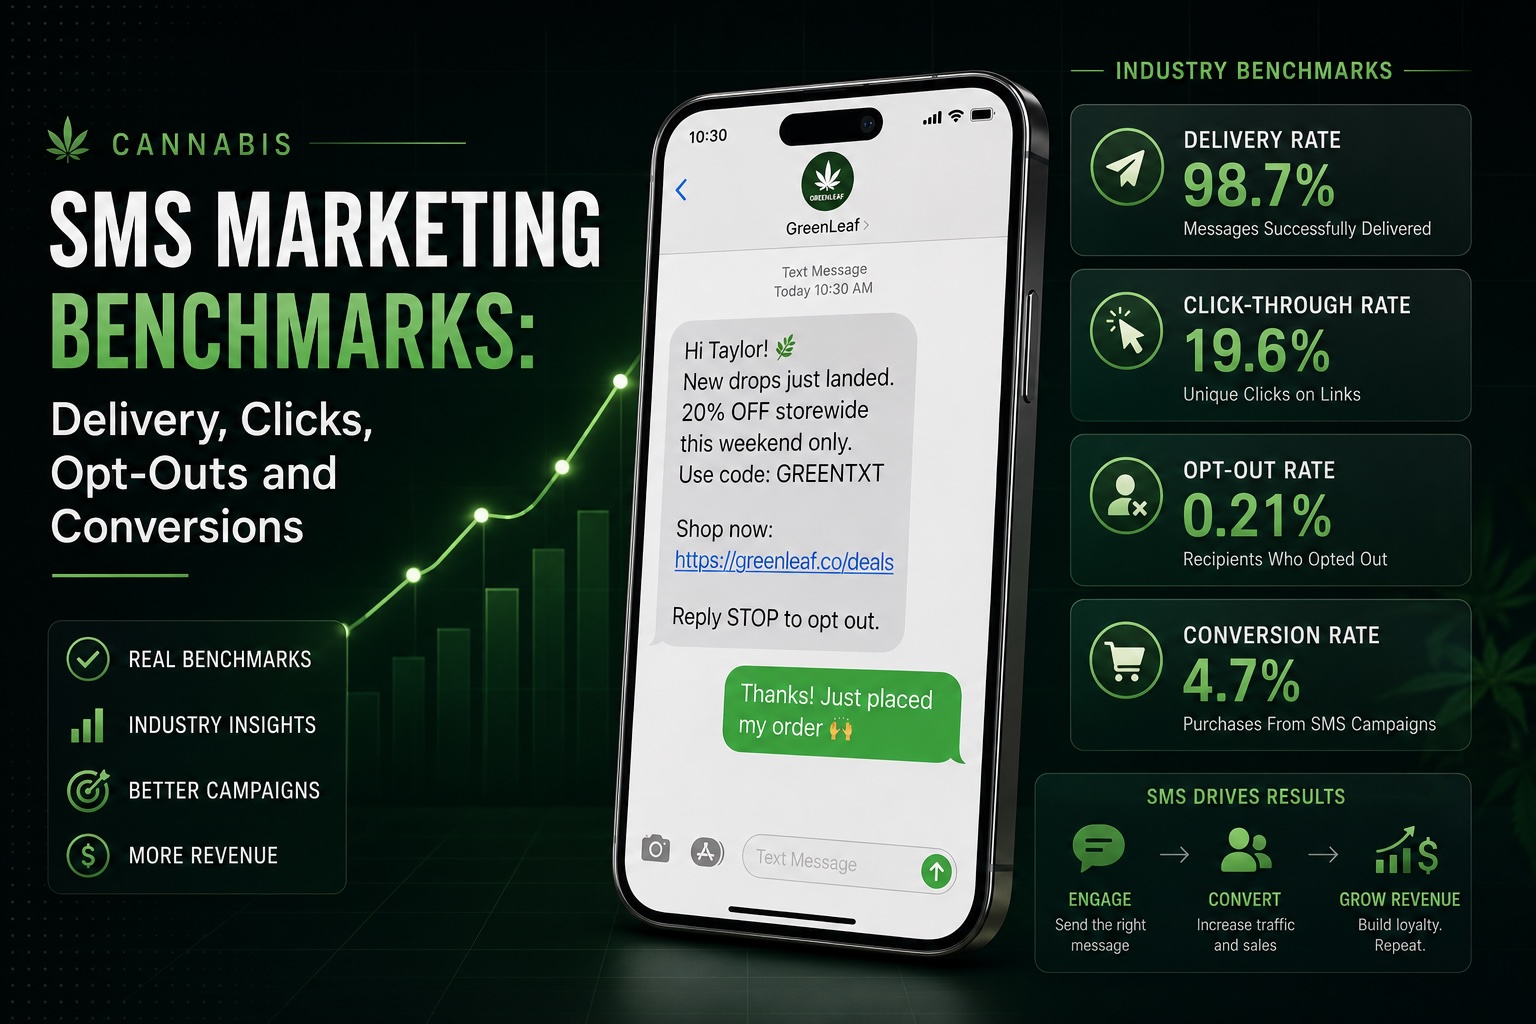
Cannabis SMS marketing benchmarks are performance baselines used to compare dispensary text campaigns across delivery, engagement, opt-outs, conversions, revenue, and customer retention. The most reliable benchmark is usually the dispensary’s own historical performance for the same campaign type, audience, offer, location, and measurement window. Universal averages can be misleading when they combine unrelated message types and attribution methods.
Dispensary operators often ask what a good SMS delivery rate, click rate, conversion rate, or opt-out rate should be.
The question is reasonable, but a single cannabis-industry average rarely tells an operator whether a specific campaign performed well. A broad promotional blast, birthday automation, order-ready alert, customer win-back sequence, and review request serve different purposes. They should not be graded against one universal number.
A useful benchmark compares like with like. It explains what changed, which customers received the message, how performance was measured, and whether the result improved the dispensary’s financial or operational outcome.
This guide explains how to build cannabis SMS benchmarks that operators can actually use, which metrics belong in a campaign scorecard, and how to avoid misleading comparisons.
What are cannabis SMS marketing benchmarks?
Cannabis SMS marketing benchmarks are reference points used to evaluate how a dispensary’s text campaigns perform over time and against comparable campaigns, audiences, stores, or customer groups.
A benchmark is not necessarily a public industry average. It can be:
- The median result from the dispensary’s last ten promotional sends
- The prior 90-day performance of a birthday automation
- The average delivery rate for one registered sending number
- The conversion rate for customers inactive for 60 to 90 days
- The revenue per delivered recipient at one store location
- The opt-out rate for campaigns sent once weekly
- The difference between a messaged group and a holdout group
The best benchmark is the one that helps an operator decide what to do next. It should reveal whether the campaign improved, declined, or performed normally and which part of the customer journey requires attention.
Why one universal cannabis SMS average can be misleading
Two dispensaries can report completely different results even when both operate effective programs.
One store may send a broad promotion to 50,000 subscribers. Another may send an automated message to 400 customers who have not visited in 60 days. The second campaign may produce a higher conversion rate because its audience and purpose are narrower, not because its platform is automatically better.
Factors that change SMS performance
Message purpose
Transactional alerts, promotions, review requests, win-back flows, and loyalty reminders produce different customer actions.
Audience quality
Recent customers, inactive customers, imported contacts, and new subscribers have different levels of intent and engagement.
Offer strength
A deep discount can increase clicks and transactions while reducing gross profit and training customers to wait for offers.
Measurement window
A same-day conversion window will report differently from a seven-day window, even for the same message and audience.
Store and market conditions
Inventory, pricing, competition, payday timing, location, weather, and local events can influence customer behavior.
Attribution method
Tracked clicks, offer codes, customer matching, and holdout tests do not assign campaign credit in the same way.
Do not compare two rates until the numerator, denominator, audience, campaign type, and measurement period are defined. Metrics with the same label can represent different calculations.
The five groups of dispensary SMS benchmarks
A complete scorecard should separate metrics into five groups. This keeps an operator from treating one strong number as proof that the entire campaign worked.
Did the messaging infrastructure successfully reach the intended audience?
Did recipients click, reply, open a landing page, or otherwise interact?
Did recipients complete the campaign’s intended action?
Did the campaign produce opt-outs, complaints, invalid numbers, or audience fatigue?
Did the campaign produce revenue, gross profit, retention, or operational savings worth the cost?
These groups follow the customer journey. A message must first be sent, then delivered, then noticed, then acted upon, and finally connected with a useful business outcome.
Cannabis SMS delivery benchmarks
Delivery benchmarks evaluate whether the message reached the intended recipient or entered a failure state.
Delivery rate
Use one consistent definition of attempted messages. Exclude contacts suppressed before sending, but document whether invalid numbers and immediate failures remain in the denominator.
Failure rate
A falling delivery rate can indicate several different problems:
- Invalid or disconnected customer numbers
- Carrier filtering or policy rejection
- Sender-registration problems
- Unusual traffic patterns or sudden volume changes
- List-quality problems following an import
- A technical problem with a specific carrier or route
- Incorrect handling of previously suppressed recipients
Benchmark delivery by carrier, sender, and campaign type
One blended delivery percentage can hide a concentrated problem. Review delivery by:
- Sending number or messaging profile
- Carrier, when that information is available
- SMS versus MMS
- Campaign versus automation
- Location or customer list source
- Message length and segment count
- Link domain or landing-page type
For troubleshooting guidance, review Blackleaf’s SMS deliverability troubleshooting guide .
Click and engagement benchmarks
Clicks are useful when a message includes a trackable link, but they do not measure every form of customer response.
Click-through rate
Use unique recipients rather than total clicks when measuring audience response. One customer may click the same link several times.
Click-to-conversion rate
This metric helps separate message performance from landing-page or menu performance.
A campaign with a strong click rate and weak post-click conversion may have:
- A confusing or slow landing page
- An offer that is difficult to redeem
- Different pricing on the linked menu
- Products that are out of stock
- An age gate that interrupts the customer journey
- A call to action that creates curiosity without purchase intent
Measure replies separately
Two-way conversations may indicate purchase intent, confusion, customer service needs, or opt-out language that was not recognized automatically. Separate useful customer replies from HELP requests, STOP requests, automated responses, and unrelated messages.
A low click rate is not automatically a failed campaign. A customer may read a text and visit the store without clicking. Clicks are a diagnostic metric, not a complete measure of in-store behavior.
Dispensary SMS conversion benchmarks
Conversion measures whether recipients completed the action the campaign was designed to produce.
The definition must change with the campaign objective.
| Campaign | Primary conversion | Possible secondary conversion |
|---|---|---|
| Promotional campaign | Eligible purchase or store visit | Tracked menu visit or offer redemption |
| Win-back campaign | Inactive customer returns | Customer returns again after reactivation |
| Order-ready alert | Order is successfully picked up | Reduced support contact or cancellation |
| Review request | Customer submits feedback or a review | Customer reaches the intended review destination |
| Birthday automation | Birthday-period purchase | Reward redemption or later repeat visit |
| List-growth campaign | Valid new opt-in | Subscriber completes a first purchase |
Recipient conversion rate
Incremental conversion lift
A holdout or similar comparison group helps estimate how much customer activity might have occurred without the message.
Conversion benchmarks should use the same attribution window. Comparing a 24-hour campaign with a seven-day campaign without disclosing the difference will make the longer campaign appear stronger.
Opt-out and list-health benchmarks
Opt-outs measure how many recipients asked to stop receiving future marketing messages. They are one of the most important indicators of audience fatigue and expectation mismatch.
Opt-out rate
Use campaign-specific opt-outs when possible. A customer who opts out several days later after receiving multiple messages may not be attributable to one send with certainty.
What increases opt-outs?
- Sending more frequently than customers expected
- Sending irrelevant offers to the full list
- Weak or misleading signup language
- Importing old customer records without dependable consent
- Sending the same promotion repeatedly
- Overlapping campaigns and automations
- Messaging customers for the wrong store or market
- Using urgency in nearly every message
- Failing to provide value outside discounts
Track opt-outs by signup source
The campaign may not be the only problem. Customers collected through a clear loyalty enrollment may behave differently from contacts imported from an old database or collected through a vague checkout checkbox.
Segment opt-out reporting by:
- Signup source
- Subscriber age
- Store location
- Campaign frequency
- Customer activity
- Offer type
- Campaign versus automation
An opt-out does not create an immediate invoice, but it removes future access to that customer through promotional texting unless valid new consent is later obtained. Short-term revenue should therefore be considered alongside list loss.
Revenue, profit, and retention benchmarks
Revenue benchmarks connect campaign activity with financial performance. They should not be limited to the largest attributed-sales number available in the reporting system.
Revenue per delivered recipient
Gross profit per delivered recipient
Revenue per messaging dollar
This is a revenue-efficiency metric, not a complete ROI calculation. It does not account for product cost, discounts, or sales that would have occurred without the campaign.
Repeat-visit rate
A campaign may produce a discounted purchase without creating a durable customer relationship. Measure whether reactivated or newly acquired customers return again after the first campaign-related transaction.
For a complete financial framework, read Cannabis SMS Marketing ROI .
Benchmark similar campaign types separately
Build separate baselines for each major message type. Combining all messages into one average hides important differences.
| Campaign type | Primary benchmark | Important supporting benchmarks |
|---|---|---|
| Broad promotion | Incremental gross profit per delivered recipient | Delivery, clicks, conversion, opt-outs |
| Segmented promotion | Conversion lift against a similar full-list campaign | Audience size, revenue per recipient, opt-outs |
| Win-back automation | Reactivated-customer rate | Cost per reactivation, repeat visit, offer expense |
| Birthday automation | Birthday-period conversion | Reward cost, ticket, later repeat visit |
| Order notification | Pickup completion | Cancellation, support contacts, response time |
| Review request | Completed reviews or feedback submissions | Clicks, routing completion, customer response |
| List-growth effort | Valid opt-ins per customer opportunity | First purchase, later engagement, early opt-outs |
How to build internal dispensary SMS benchmarks
A useful baseline does not require years of data. Start with a consistent reporting structure and improve it as campaign volume grows.
Define each metric
Document the numerator, denominator, attribution window, and exclusions used for delivery, clicks, conversions, opt-outs, revenue, and profit.
Group campaigns by purpose
Separate promotions, automations, transactional messages, review requests, and list-growth campaigns.
Record audience characteristics
Save location, customer recency, list source, audience size, purchase behavior, and relevant eligibility rules.
Use consistent measurement windows
Choose a standard window for each campaign type and document any exceptions before viewing results.
Collect enough comparable campaigns
A baseline built from several similar campaigns is more useful than one unusually strong or weak send.
Use the median as well as the average
The median reduces the influence of one unusually large result and often represents typical performance more accurately.
Create recent and long-term baselines
Compare the last 30 or 90 days with the prior year or longer-term history to identify recent change and seasonality.
Review benchmark movement monthly
Look for sustained changes in delivery, engagement, conversion, opt-outs, and financial value rather than reacting to one send.
Minimum useful benchmark record
Save these fields for every campaign
- Campaign name and unique ID
- Store or market
- Campaign type
- Send date and time
- Eligible audience size
- Attempted recipients
- Delivered recipients
- Unique clicks
- Unique opt-outs
- Defined conversions
- Attribution window
- Attributed revenue
- Gross profit when available
- Total campaign cost
- Offer or incentive expense
- Holdout or baseline method
How to diagnose a weak cannabis SMS campaign
Do not begin by rewriting the message. Identify the stage where performance declined.
| Observed result | Likely area to inspect | Questions to ask |
|---|---|---|
| Low delivery | Infrastructure, registration, list quality | Did failures increase by carrier, sender, list source, or message type? |
| Good delivery, low clicks | Audience relevance, offer, message clarity | Was the reason to act clear and relevant to the segment? |
| Good clicks, low conversions | Landing page, menu, inventory, redemption process | Did the destination match the promise in the message? |
| Good sales, weak profit | Discount depth, product margin, campaign cost | Did the promotion generate profitable incremental demand? |
| Strong response, high opt-outs | Frequency, expectation mismatch, offer dependence | Did the campaign create short-term action at the expense of future audience access? |
| Good first purchase, weak repeat behavior | Customer quality, incentive dependence, experience | Did customers return after the initial campaign offer? |
A practical dispensary SMS benchmark scorecard
Each campaign report should show the current result, the comparable baseline, and the amount of change.
| Metric | Current campaign | Comparable baseline | Change | Interpretation |
|---|---|---|---|---|
| Delivery rate | Current result | Median of comparable sends | Percentage-point change | Infrastructure and list health |
| Unique click rate | Current result | Same campaign type | Percentage-point change | Message and audience interest |
| Conversion rate | Current result | Same attribution window | Percentage-point change | Customer action |
| Opt-out rate | Current result | Same audience and frequency | Percentage-point change | List health and fatigue |
| Revenue per recipient | Current result | Same campaign purpose | Currency change | Audience-level revenue efficiency |
| Gross profit per recipient | Current result | Same offer and margin method | Currency change | Financial quality |
Use percentage-point change when comparing rates. A click rate that moves from 2% to 3% increased by one percentage point, even though the relative increase is 50%.
Common cannabis SMS benchmarking mistakes
Using an unsupported industry average as a guarantee
A public average may combine industries, campaign types, vendors, geographies, and measurement methods. Treat it as context, not a promise.
Comparing campaigns with different objectives
A review request should not be judged by immediate sales. An order alert should not be judged by promotional click rate.
Changing the denominator
A click rate calculated from sent messages cannot be compared directly with one calculated from delivered messages unless the difference is disclosed.
Using total clicks instead of unique clickers
Repeated clicks by one customer can make engagement appear stronger than the number of people who actually responded.
Ignoring statistical noise
A campaign sent to 100 customers can swing dramatically when only a few people behave differently. Small audiences should be interpreted with caution.
Combining all stores into one average
One large location can hide poor performance at smaller stores. Review location-level results before relying on the blended total.
Ignoring message and offer cost
High revenue does not prove strong return when the campaign used several message segments, expensive media, deep discounts, or low-margin products.
Reporting only the strongest result
A useful benchmark program includes weak campaigns, failed tests, and normal performance. Selecting only successful sends creates an unrealistic baseline.
How Blackleaf supports dispensary SMS benchmarking
Blackleaf is designed for dispensary campaigns, automations, audience segmentation, two-way messaging, order communication, and performance measurement.
Operators can use campaign and customer data to compare message delivery, audience engagement, attributable customer behavior, revenue per send, and repeat visits.
The platform provides the reporting inputs, but each dispensary should still define what a conversion means, which attribution window applies, how campaign costs are allocated, and which historical campaigns form a fair comparison group.
Explore Blackleaf’s dispensary text messaging platform or review the complete guide to cannabis SMS marketing .
Frequently asked questions
What are cannabis SMS marketing benchmarks?
Cannabis SMS marketing benchmarks are reference points used to compare dispensary texting performance across delivery, engagement, conversions, opt-outs, revenue, profit, and customer retention.
What is a good dispensary SMS delivery rate?
A useful delivery target should be based on the dispensary’s own recent performance for the same sender, list source, message type, and market. A sudden decline from the established baseline is often more actionable than comparison with a broad external average.
What is a good cannabis SMS click rate?
The appropriate click benchmark depends on whether the message contains a link, the campaign objective, audience relevance, offer, and destination. Compare unique clickers divided by delivered recipients across similar campaigns.
How should dispensaries calculate SMS opt-out rate?
Divide unique opt-outs associated with the campaign by delivered messages and multiply by 100. Use a consistent attribution period and separate automated STOP requests from unrelated replies.
Should SMS conversion rate use sent or delivered messages?
Delivered recipients usually provide the more useful denominator for campaign conversion because customers cannot respond to a message they did not receive. The selected definition should be documented and used consistently.
Are clicks enough to measure dispensary SMS performance?
No. Clicks indicate interaction with a link but do not prove a store visit, purchase, review, profit, or repeat visit. They should be considered with conversion, revenue, gross profit, opt-outs, and customer behavior.
Why should dispensaries use internal SMS benchmarks?
Internal benchmarks reflect the dispensary’s actual customers, stores, offers, sending frequency, margins, and measurement methods. They make campaign comparisons more relevant than a broad average assembled from unrelated businesses.
How many campaigns are needed to establish a benchmark?
There is no universal minimum. Several comparable campaigns are more useful than one result. Begin tracking immediately, label early baselines as preliminary, and update them as more comparable campaign data becomes available.
Should automated texts and promotional blasts use the same benchmarks?
No. Automations usually reach smaller audiences based on specific customer events, while promotional campaigns may reach broad lists. Their purpose, timing, audience intent, and conversion definitions are different.
What is the most important dispensary SMS benchmark?
The most important benchmark depends on the campaign objective. For a promotion it may be incremental gross profit per recipient. For an order alert it may be pickup completion. For a review request it may be completed customer reviews.
Turn every dispensary text campaign into a measurable benchmark
Blackleaf helps dispensaries run targeted campaigns, automate customer communication, monitor delivery, and connect messaging performance with customer behavior and revenue.
Talk to BlackleafMethodology note: This guide does not present unsupported universal cannabis-industry averages. Benchmark definitions should be documented and applied consistently. Tracked campaign parameters can identify website traffic generated by SMS links, but clicks should be evaluated alongside customer transactions, conversions, opt-outs, and financial outcomes.