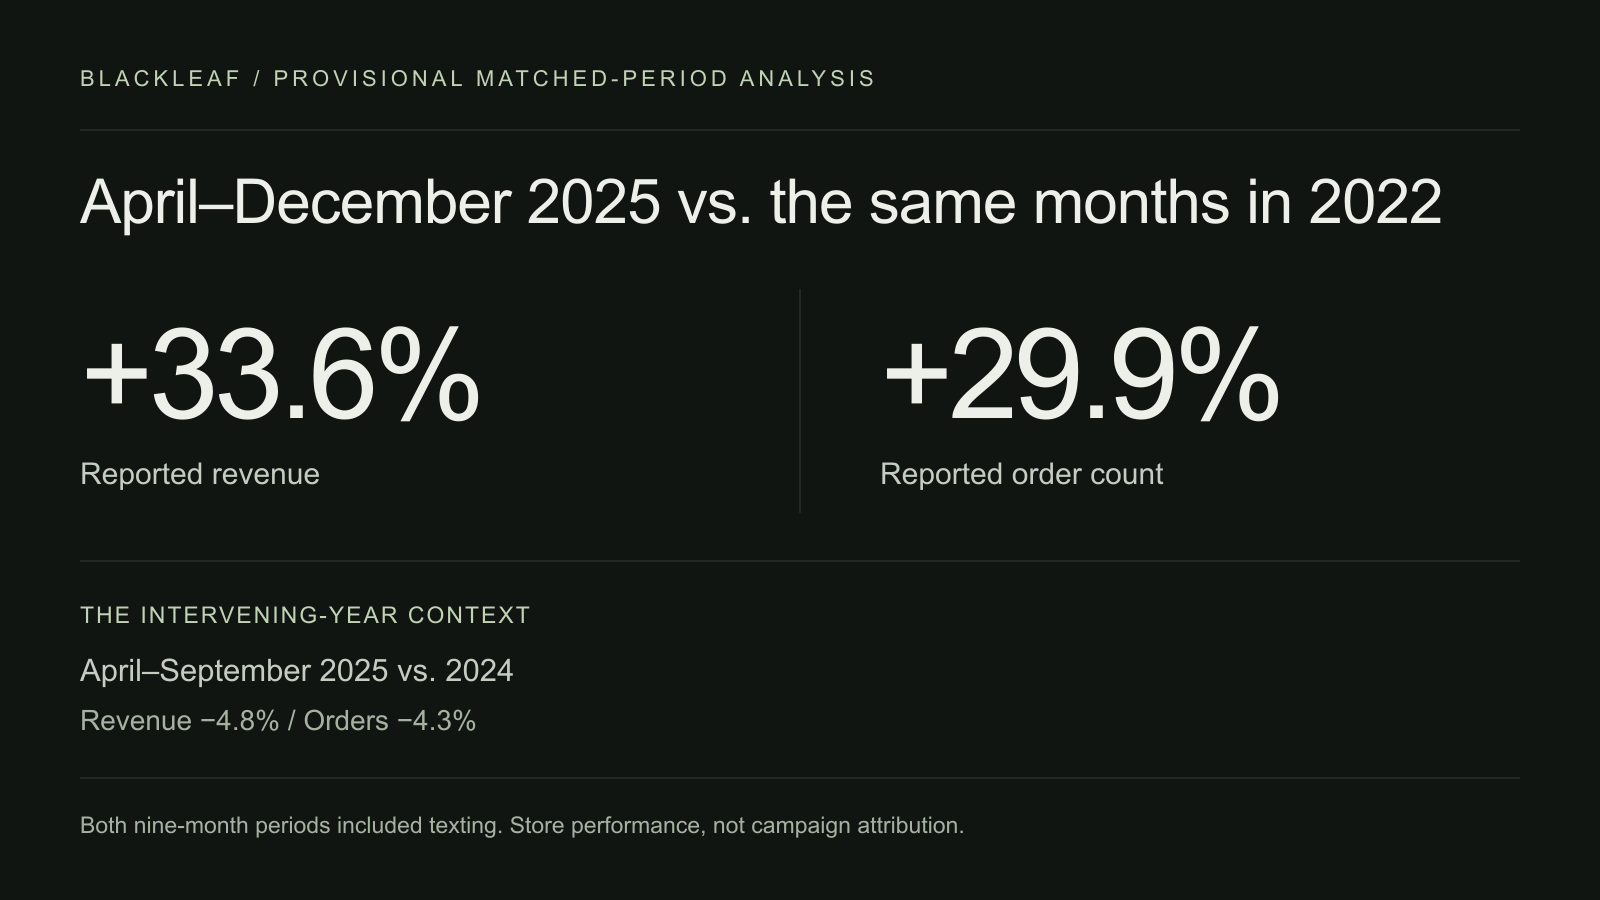
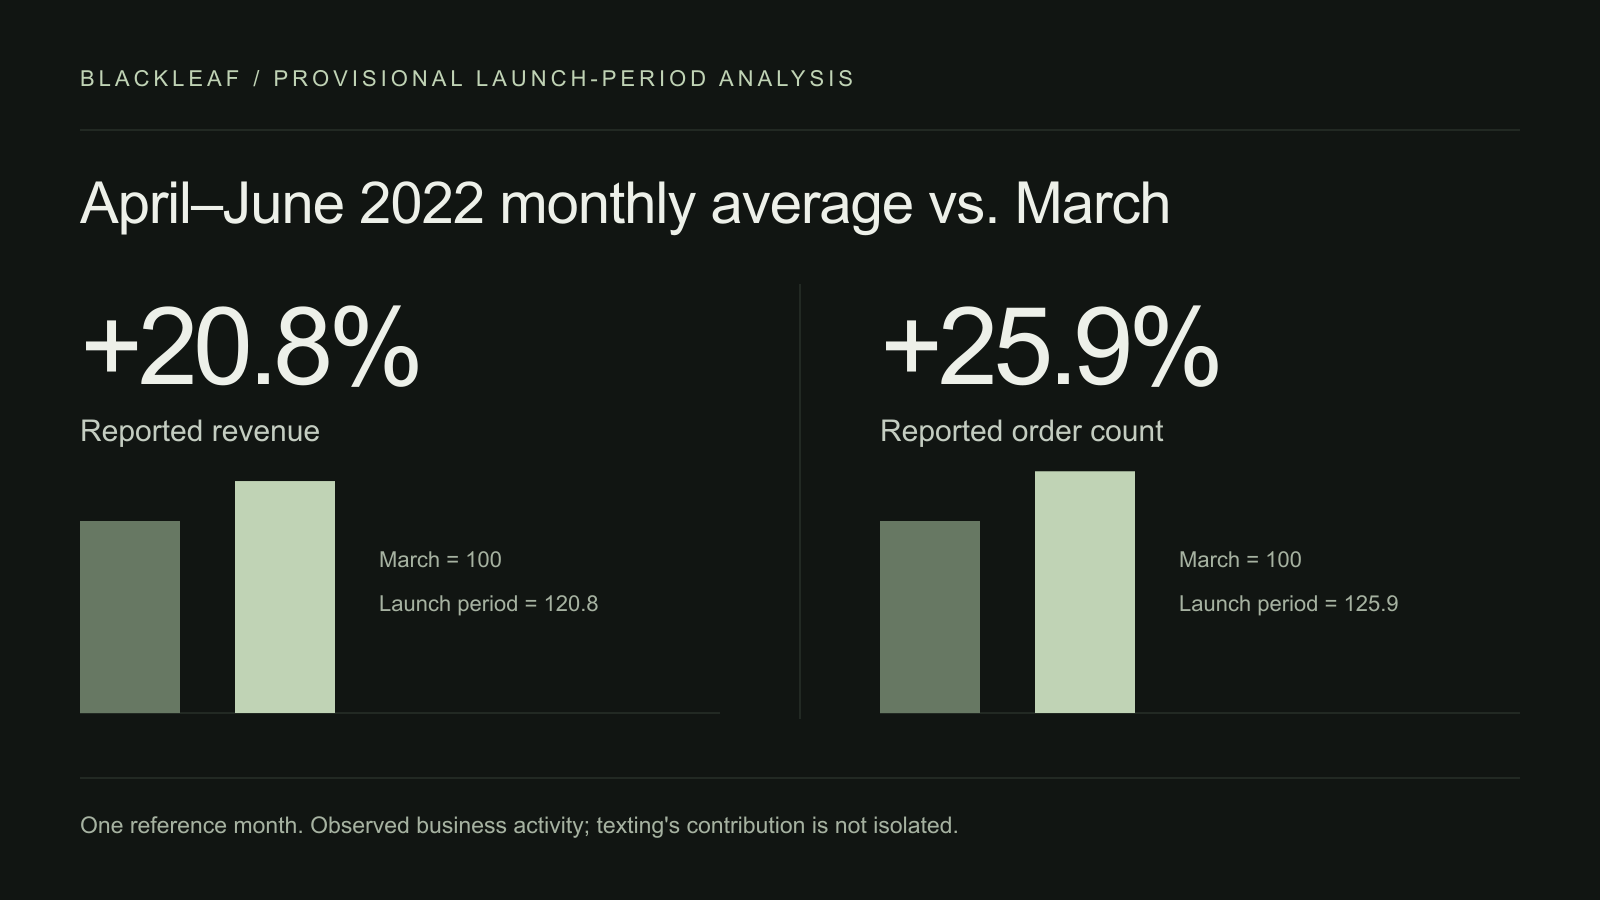
An anonymized monthly-report analysis recorded average monthly revenue 20.8% higher and orders 25.9% higher in April–June 2022 than in March 2022. In a separate matched-period comparison, revenue was 33.6% higher and orders 29.9% higher across April–December 2025 than across the same months in 2022.
These figures describe reported store performance around and after an operator-reported April 2022 Blackleaf texting launch. They do not isolate texting’s contribution. The comparisons come from a provisional analysis prepared on October 7, 2026, rather than a new audit of transaction or campaign exports.
Evidence at a glance
- Launch window: April–June 2022 monthly averages versus March 2022: revenue +20.8%; orders +25.9%.
- Matched window: April–December 2025 versus the same months in 2022: revenue +33.6%; orders +29.9%. Both periods included texting.
- Year-to-year context: April–September 2025 versus 2024: revenue −4.8%; orders −4.3%.
- Source: Provisional October 7, 2026 analysis of manually transcribed operator-supplied monthly-report screenshots. Original exports and reporting scope were not independently audited.
- Relationship: Blackleaf’s own marketing analysis. Its founder operates a dispensary; the reporting store’s ownership relationship is not established.
- Limits: One-month launch reference; no isolated SMS lift or retention finding. This is not an independent customer endorsement.
The first three calendar months with texting
The operator account recorded in the earlier analysis places the texting start in April 2022. March 2022 supplies a pre-launch reference month; April–June supplies three calendar months beginning with that reported launch. The exact start day was not established.
| Compared with March 2022 | Revenue change | Order-count change |
|---|---|---|
| April 2022 | +12.4% | +13.8% |
| April–June monthly average | +20.8% | +25.9% |
| April–June daily average | +23.5% | +28.7% |
Monthly and daily averages answer different questions. March contains 31 calendar days, while April–June contains 91. The daily comparison normalizes those period lengths; it is not a separate campaign result. Three calendar months should not be relabeled as an exact first-90-days study.
March is a single reference month, not a multi-month baseline or a control group. April includes 4/20, and the earlier review did not control for seasonal demand, other promotions, inventory, pricing, store hours, or operating changes. Consistent store and reporting scope still require verification against the source records.
A longer view: matched nine-month periods
The earlier review sums reported revenue and order counts across April–December in each year before comparing totals. This aligns calendar months and avoids presenting a partial period as a full-year result.
| April–December measure | Reported change, 2025 versus 2022 |
|---|---|
| Revenue | +33.6% |
| Order count | +29.9% |
| Aggregate revenue per order | +2.9% |
Aggregate revenue per order is total reported revenue divided by total reported orders. It does not establish gross profit, customer lifetime value, or improved retention. The 2.9% figure is carried from the earlier analysis; it cannot be reconstructed exactly from the already-rounded headline percentages and remains subject to checking against unrounded totals.
Because the operator-reported texting start was April 2022, the 2022 comparison period already includes texting. It cannot serve as an untreated pre-texting baseline.
Keep the intervening-year context
April–September is the six-month window visible in each of the three yearly reports described by the earlier review. With 2022 indexed to 100, the analysis reports:
| April–September | Revenue index | Orders index |
|---|---|---|
| 2022 | 100.0 | 100.0 |
| 2024 | 142.5 | 139.5 |
| 2025 | 135.6 | 133.5 |
In this six-month comparison, 2025 remained above 2022 but fell below 2024: reported revenue declined 4.8% and orders declined 4.3%. The records do not support a story of uninterrupted annual growth. These six-month indexes describe a different window from the nine-month headline.
What the results mean for a texting program
The launch period recorded more reported business activity than the preceding month. The longer comparison recorded higher revenue and order totals than the same months three years earlier. Those observations are useful context, but they do not determine how much revenue messaging caused or how another provider would have performed.
A store evaluating texting needs both business reporting and campaign evidence. Business reporting shows the wider operating trend. Campaign analysis connects a defined eligible audience, send, cost, and outcome.
For a texting-specific study, retain delivery records, linked purchases, refunds, discounts, messaging and platform costs, and a suitable comparison group. Where practical, use a randomly assigned holdout group to estimate incremental results. Measure customer repeat purchases separately from aggregate order volume.
Blackleaf’s SMS ROI methodology distinguishes attributed purchases from incremental impact. Its benchmark definitions explain why consistent periods and denominators matter. The review campaign case study covers a different outcome: completed reviews.
Method, privacy, and commercial disclosure
This article reproduces figures from an anonymized analysis prepared on October 7, 2026. That analysis describes manually transcribed operator-supplied monthly-report screenshots. Original exports, accounting definitions, transcription accuracy, and consistent reporting scope have not been independently audited for this publication. The findings are provisional.
Store name, location, staff and customer identities, exact financial totals, logos, and original screenshots are withheld. Indexes reduce disclosure of financial scale but do not guarantee that a business cannot be recognized.
Blackleaf prepared and publishes this first-party analysis for its own marketing. Blackleaf’s founder also operates a dispensary. The earlier anonymized source does not establish the reporting store’s ownership relationship, and this article does not present an independent customer endorsement.
Frequently asked questions
Did Blackleaf cause the reported growth?
The available comparison does not isolate that effect. It records business performance around and after the operator-reported texting launch.
Does the launch comparison establish a 20.8% SMS lift?
No. The 20.8% describes a reported average-monthly revenue comparison against March 2022, not an isolated effect caused by texting.
Do more orders prove better customer retention?
No. Retention requires customer-level repeat-purchase or cohort records. Aggregate orders alone cannot establish it.
Can the six-month and nine-month figures be combined?
No. Keep the calendar windows, measures, and comparisons separate.
Build a campaign you can measure
Choose one customer opportunity, define the eligible audience, document the baseline, and agree on the outcome and cost model before sending. The Blackleaf Revenue Pilot provides a framework for a defined campaign test.